
Figure 2.
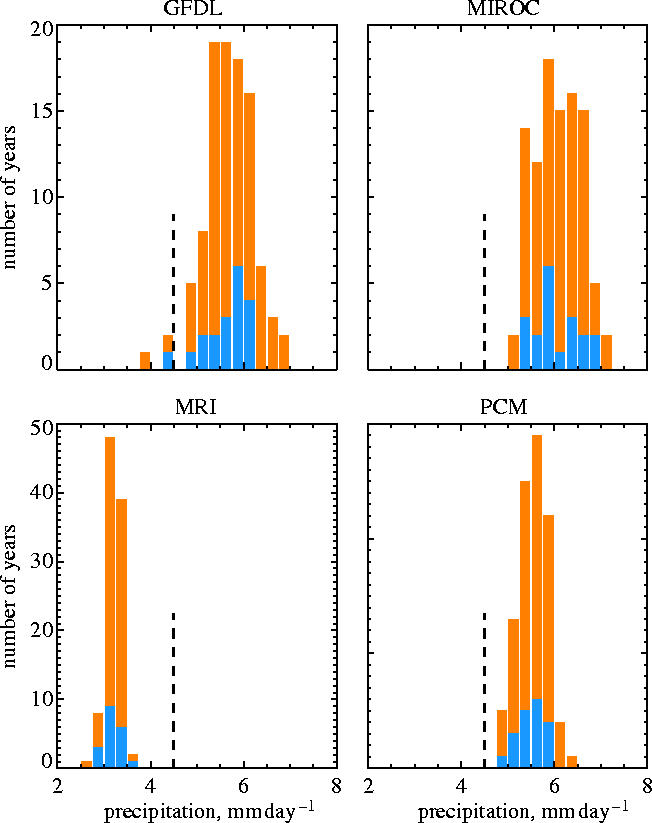
Transient GCM estimates of precipitation for the region, season and years as the observed data given in figure 1 (note different vertical scales). None of the simulations capture the observed mean drying for the period in blue (years 1971–1989).