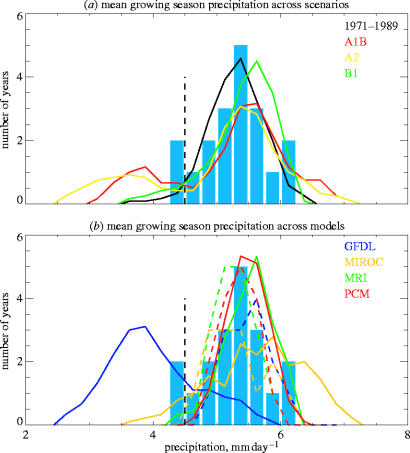
Figure 4.
Mean growing season precipitation, divided into bins of 0.25 mm day−1. Both plots are normalized to a total of 19 years. (a) The coloured lines are averages across all four GCMS for the three SRES scenarios for the period 2081–2099. The black line is the average across all GCMs for their estimates of 1971–1989. All GCM values are ‘nudged’ by removing the mean value for 1971–1989 calculated by that GCM and adding on the observed mean for the same period. The GCMs, therefore, only provide information on the distribution about the mean for each 19 year period and future changes in the mean. (b) The solid coloured lines are averages across all three scenarios for each GCM for 2081–2099. The dashed coloured lines are GCM estimates for 1971–1989. The blue bars and vertical black dashed line plotted in both panels have the same meaning as in figure 1.

