
Figure 5.
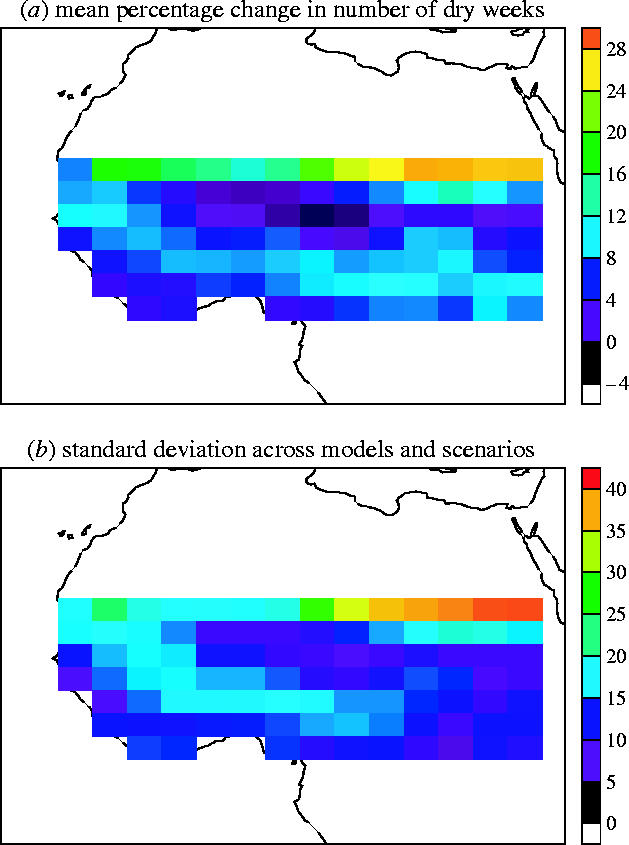
Model predictions of changes in frequency of low rainfall. For each climate model during the period (1971–1989) and for the growing season defined as July–September, we calculate the average daily precipitation threshold below which 10% of all consecutive 7 day periods fall. For all models and all three SRES scenarios, we calculate the percentage changes in occurrence of 7 day periods drier than that threshold for 2081–2099. (a) The mean percentage change across all models and scenarios is plotted, while in (b) the standard deviation across models and scenarios is plotted.