
Figure 6.
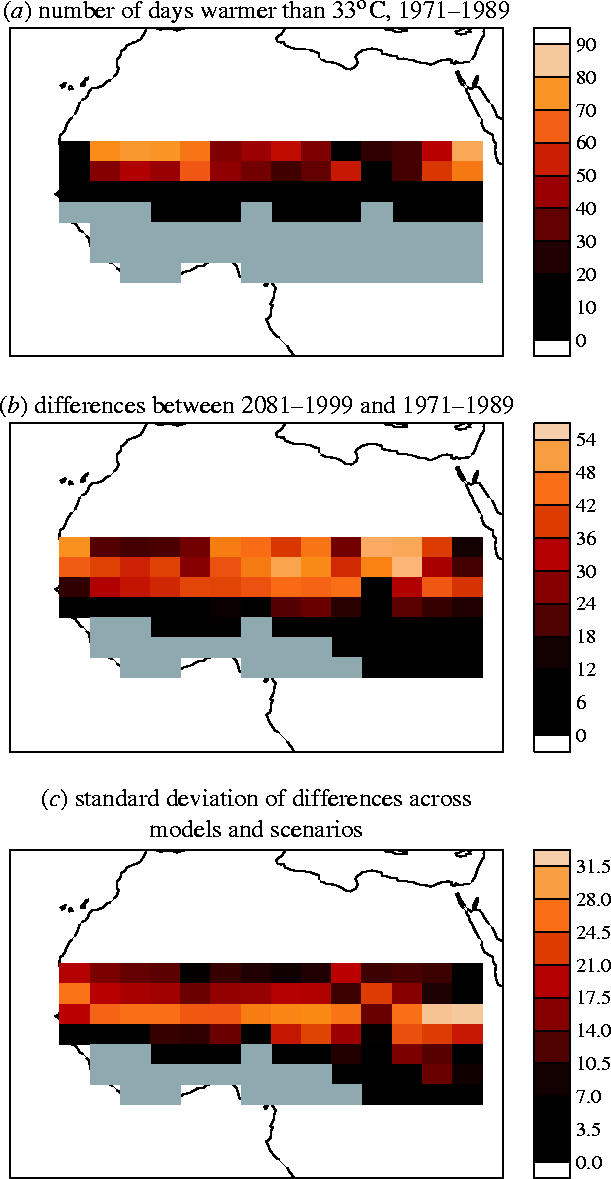
Model predictions of changes in number of ‘hot days’. For each climate model during the period (1971–1989), and for the growing season defined as July–September, we calculate the number of days where the mean temperature is greater than 33 °C. The grey area corresponds to regions, where there are no days greater than this threshold. (a) Model values (averaged across all models), but ‘nudged’ such that the monthly mean values equal those from the Hulme dataset for the period 1971–1989. (b) For all models and all three SRES scenarios, we calculate the changes in number of days greater than 33 °C. (c) The standard deviation across models and scenarios of the change presented in (b).