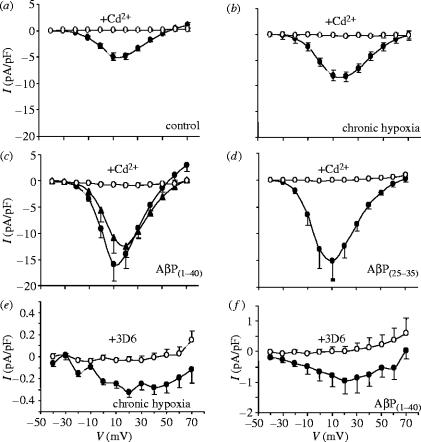
Figure 2.
Augmentation of Ca2+ channel currents in PC12 cells by hypoxia and AβPs. Mean (+s.e.m. bars) Ca2+ channel current–voltage (I–V) relationships obtained from PC12 cells in the absence (solid circles) and presence (open circles) of 200 μM Cd2+. (a) I–V relationships obtained from 20 control (normoxically cultured) cells. (b) I–V relationships obtained from 28 cells maintained in 10% O2 for 24 h prior to recordings. (c) I–V relationships from nine cells exposed to 100 nM AβP1–40 for 24 h prior to recording (also shown are mean data from 14 cells exposed to 20 nM AβP1–40 for 24 h, in the absence of Cd2+; solid triangles). (d) I–V relationships from nine cells exposed to AβP25–35 for 24 h. (e) Mean I–V relationships taken from hypoxically cultured cells, recorded in the presence of 200 μM Cd2+ (solid circles). Open circles show data from identically treated cells, except that they were exposed to the 3D6 antibody (5 μg ml−1; 1 h). (f) As in (e), except that cells were exposed to amyloid petides (as in (c)) rather than hypoxia (n=8–15 cells in each case).

