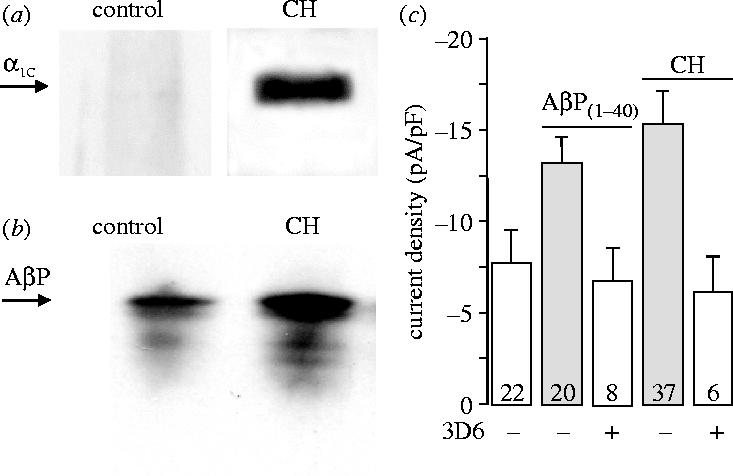
Figure 6.

Evidence for co-localization of amyloid peptide and Ca2+ channels. (a) Western blots probed with the anti-α1C antibody, following immunoprecipitation of cell homogentates using the 3D6 monoclonal anti-amyloid antibody. Note marked immunodetection in hypoxic but not normoxic cells. Representative of six experiments. (b) Detection of AβPs in samples of control and hypoxic cell homogenates, immunoprecipitated using the anti-α1C antibody as indicated. Blots were probed using the 3D6 antibody. Representative of six experiments. (c) Bar graph plotting mean (+s.e.m.) current density observed at a test potential of +20 mV in control cells, cells exposed to 20 nM AβP1–40 for 24 h, and cells exposed to chronic hypoxia (as indicated) either with (open bars) or without (shaded bars) subsequent exposure to the anti-amyloid peptide monoclonal antibody 3D6 (5 μg ml−1). Values in bars indicate n numbers.
