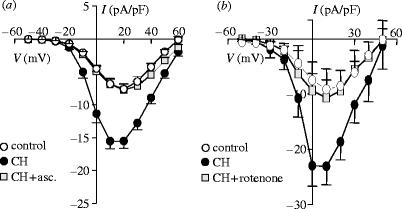
Figure 7.
Involvement of mitochondrial ROS in hypoxic augmentation of Ca2+ channels. (a) Mean (+s.e.m.) current density–voltage relationships obtained in HEK-293 cells stably expressing L-type Ca2+ channel α1C subunits. Cells were cultured under normoxic conditions (open circles), hypoxic conditions (solid circles) or hypoxic conditions in the additional presence of 200 μM ascorbic acid (asc., squares). Data were obtained between 7 and 12 cells for each experimental condition. (b) Mean (+s.e.m.) current density–voltage relationships obtained in HEK-293 cells stably expressing L-type Ca2+ channel α1C subunits. Cells were cultured under normoxic conditions (open circles), hypoxic conditions (solid circles) or hypoxic conditions in the additional presence of 1 μM rotenone (squares). Data were obtained between 8 and 30 cells for each experimental condition.

