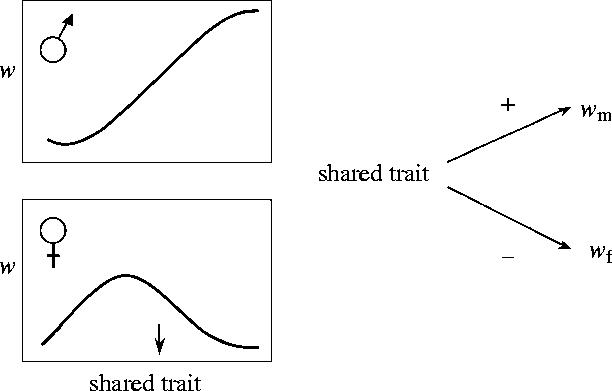
Figure 1.

A path diagram (right) illustrating the sign of the correlation between the shared trait and male (wm) and female (wf) relative fitness for patterns of selection depicted on the left. In this case, the mean value of the shared trait in the population (indicated by the arrow in the bottom left figure is such that there is selection for increased values in males (top left) and for reduced values in females (bottom left).
