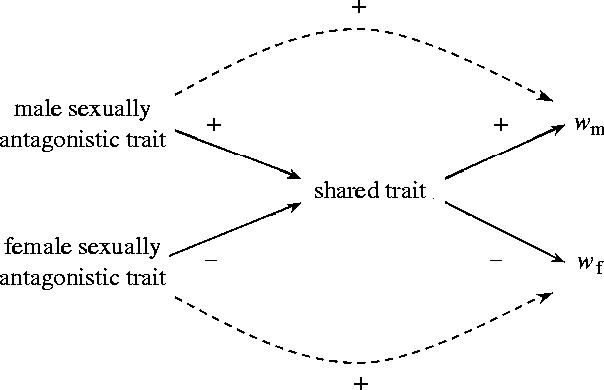
Figure 2.

A path diagram illustrating the minimum number of correlations required to demonstrate that male and female traits are sexually antagonistic. These are the sign of correlations (solid lines) between male and female sexually antagonistic traits and the shared trait, and between the shared trait and male and female relative fitness (as in figure 1). There are also correlations (dashed lines) between the male and female sexually antagonistic traits and their relative fitnesses. These lines are dashed to indicate that the correlation is not causal, but exists because these traits affect the value of the shared trait and thereby fitness.
