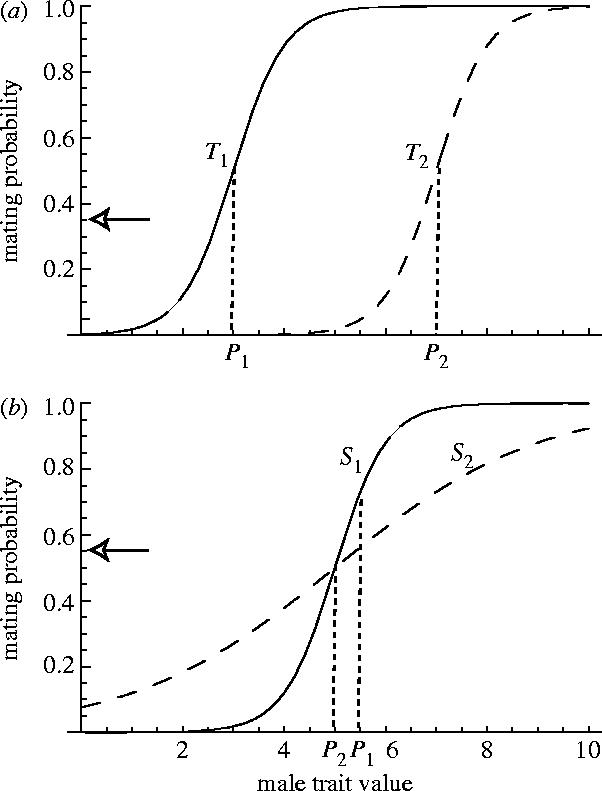
Figure 3.

An illustration of the threshold and sensitivity of the female preference function and their coevolution with male sexually antagonistic traits. (a) Solid curve is meant to represent the state of the preference function T1 and the male trait P1 early in their coevolution. There is sexual conflict over mating rate, and T and P are sexually antagonistic traits. The preference function is constrained so that only its threshold can evolve. The optimal mating rate is indicated by the arrow, and it is below the rate achieved at T1 and P1. Therefore, we expect T1 to evolve towards T2. Because the preference exerts selection for exaggeration of P, we expect P1 to evolve towards P2. T and P are expected to continue this evolutionary trajectory until natural selection on either of them halts their joint evolution. (b) This is a similar representation as (a) except in this case the slope (sensitivity) of the preference function is allowed to evolve. At S1, P1, females are mating above their optimum (indicated by the arrow). Therefore, we expect females to reduce their sensitivity to the trait towards S2. This reduces the strength of selection on P and, therefore, we might expect evolution of P towards P2 if there is natural selection against large values of P2.
