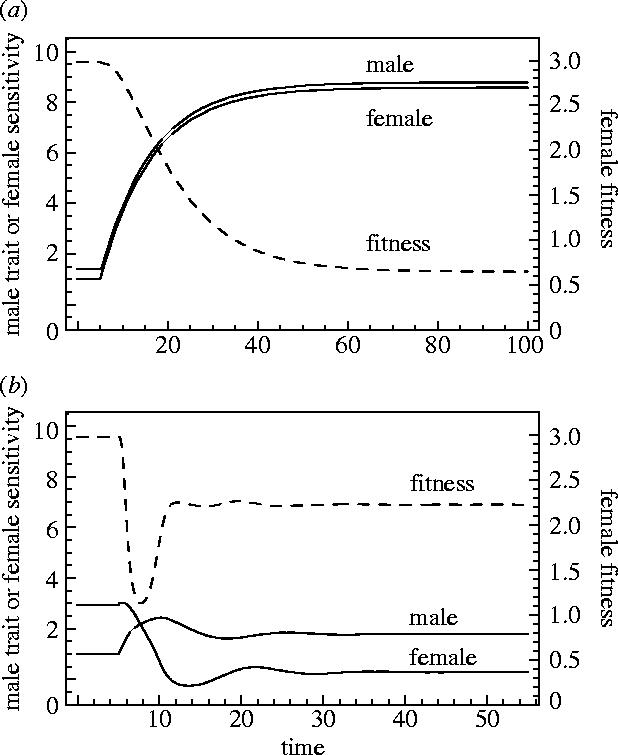
Figure 4.

These panels represent coevolutionary trajectories described in §3a. In these cases, there is sexual conflict over mating rate and there is weak natural selection on male and female sexually antagonistic traits. Solid lines represent the trajectories of male and female sexually antagonistic traits, and the dashed line represents mean female fitness. In panel (a) the female sexually antagonistic trait is the threshold of the preference function (see figure 3a) and in (b) the female trait is the sensitivity of the preference function (see figure 3b). In panel (a), there is substantial exaggeration of male and female traits until they are halted by natural selection against further exaggeration. Female fitness is greatly reduced due to the costs of mating above their optimum and the costs of an exaggerated sexually antagonistic trait. Panel (b) shows a run of the model that is similar in starting conditions, except that the female trait is the sensitivity of the preference function. In contrast to (a), sexually antagonistic coevolution results in considerably less exaggeration of the sexually antagonistic traits, and reduction in mean female fitness.
