
Figure 5.
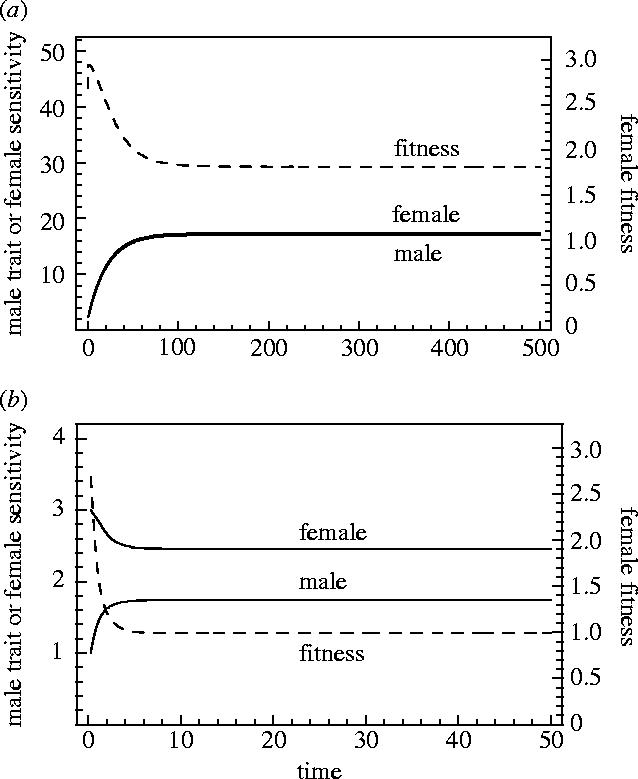
These panels represent coevolutionary trajectories described in §3a. In panel (a) the female antagonistic trait is the threshold of the preference function and in (b) it is the sensitivity of that function. In contrast to figure 4, in these cases natural selection on the sexually antagonistic traits is strong, and consequently there is less exaggeration of these traits. In both cases, there are substantial declines in female fitness.