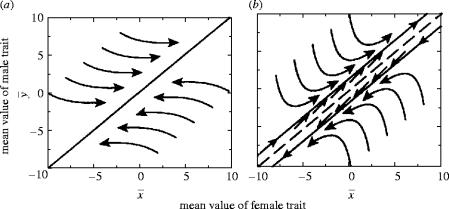
Figure 3.
Dynamics of mean trait values in Gavrilets (2000) model. (a) Costs of sexual conflict are low. Depending on where mean trait values start (above or below the line of equilibria), the trajectory is towards the line of equilibria at , at which the trait values become static. (b) Costs of sexual conflict are high. Points along line are now unstable equilibria. Direction of changes again shown by arrows; coevolutionary chase occurs along the continuous lines. Reproduced with permission of S. Gavrilets and Nature Publishing Group (http://www.nature.com).

