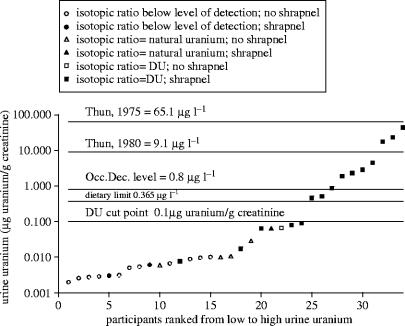
Figure 2.
Uranium concentrations in 24 h urine specimens distributed from low to high for Gulf War veterans participating in the DU Follow-Up Program surveillance visit in 2005. The top two lines (65.1and 9.1 μg l−1) represent the mean total urine uranium found in a sub-cohort of uranium fabrication workers in 1975 and 1980, as reported in a study by Thun et al. (1985). The alternating dot/dash line (0.8 μg l−1) depicts an occupational exposure decision level used at the Department of Energy's Fernald Environmental Management Project (Fernald Environmental Management Project 1997; McDiarmid et al. 2000) as a trigger for investigating work areas for sources of elevated uranium exposure. The dotted line (0.365 μg l−1) is an upper limit for the dietary contribution of uranium in urine for the general population from drinking water (ICRP 1974; McDiarmid et al. 2000). This value was calculated by dividing the upper limit for 24 h uranium excretion for ‘reference man’ by 1.4 l 24h−1. Studies have shown that corrections per gram creatinine and per litre urine are generally equal for ‘reference man’ and for this group of veterans with normal renal function (Ting 1999; NHANES 2003). The bold solid line (0.01 μg g−1 creatinine) indicates the cut point established by the DU Follow-Up Program to identify low versus high urine uranium concentrations (McDiarmid et al. 2000). Designation of natural versus depleted uranium is based on isotopic ratio results.

