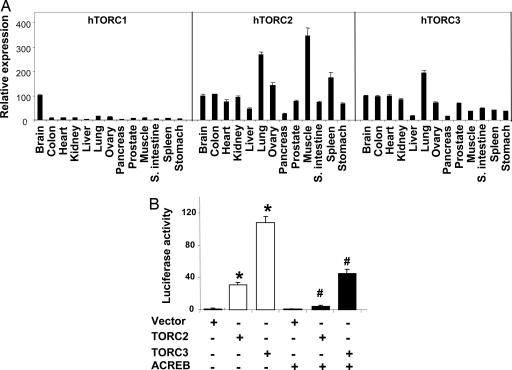
Fig. 2.
TORC2 and TORC3 strongly induce PGC-1α transcription. (A) Human tissue distribution of the TORC family. The mRNA expression levels of TORC1, 2, and 3 were measured by Q-PCR in a panel of human tissue cDNAs. The mRNA expression level of each TORC in brain is set at 100%. The mRNA expression levels in other tissues is relative to that of brain. (B) TORC2 and TORC3 induce PGC-1α promoter activity. HeLa cells were transfected with pGL3-basic-2kb-PGC1α-Luc (40 ng) and phRL-SV40 (3 ng) along with various cDNA constructs, as indicated (TORC2 or TORC3, 10 ng; ACREB, 110 ng). The cells were lysed, and the luciferase activity was determined at 48 h after transfection. The luciferase activity represents the ratio of firefly luminescence over renilla luminescence (mean ± SEM). ∗, P < 0.05, lanes 2 and 3 vs. lane 1; #, P < 0.05, lane 5 vs. lane 2 and lane 6 vs. lane 3; n = 6

