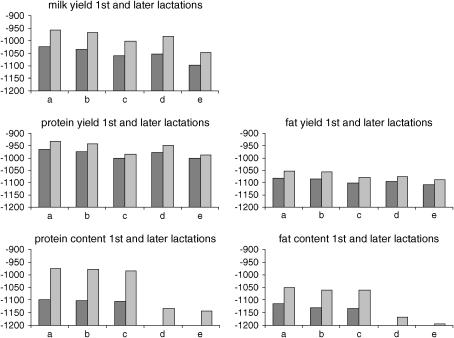
Figure 5.—
The natural logarithm of the likelihood for fitted models, respectively, from left to right: (a) model with β = [μ s1(11) s1(12) s1(22) s5(11) s5(12) s5(22) s1 × s5]T, (b) model with β = [μ s1(11) s1(12) s1(22) s5(11) s5(12) s5(22)]T, (c) model with β = [μ s1(11) s1(12) s1(22)]T, (d) model with β = [μ s5(11) s5(12) s5(22)]T, (e) model with β = μ. For each trait the left bar indicates the first lactation and the right bar indicates later lactations.

