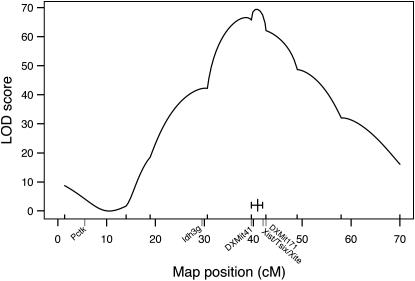
Figure 2.—
X chromosome LOD curve from extended Xce heterozygote/Xce homozygote analysis (n = 655, from B6CAST and BALBCAST intercrosses and backcrosses). LOD scores are on the y-axis; genetic positions of markers tested (from MGD) are on the x-axis. The genetic locations of Pctk1, Idh3g, Xist/Tsix/Xite, DXMit41, and DXMit171 are indicated. The 1.5-LOD confidence interval is indicated by a short, solid horizontal line, intersected by a vertical line indicating the peak. This suggests that the Xce locus is located between DXMit41 and DXMit171.

