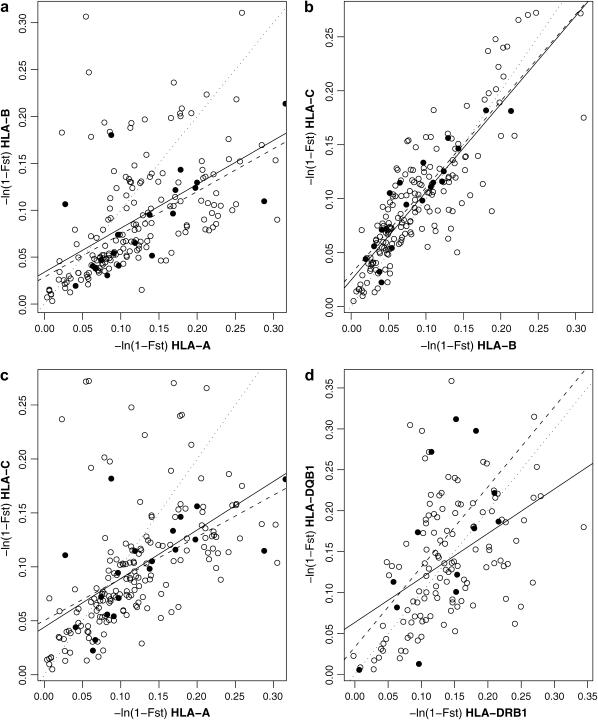
Figure 5.—
Genetic differentiation measured by D = −ln(1 − FST) between all pairs of populations for (a) HLA-A vs. HLA-B, (b) HLA-B vs. HLA-C, (c) HLA-A vs. HLA-C, and (d) DRB1 vs. DQB1. Solid circles are comparisons between populations from the same region; open circles are for populations from different regions. The dotted line represents the values for which D is the same for both loci; the solid and dashed lines are best-fit linear regressions for differentiation at the two loci between and within regions, respectively.

