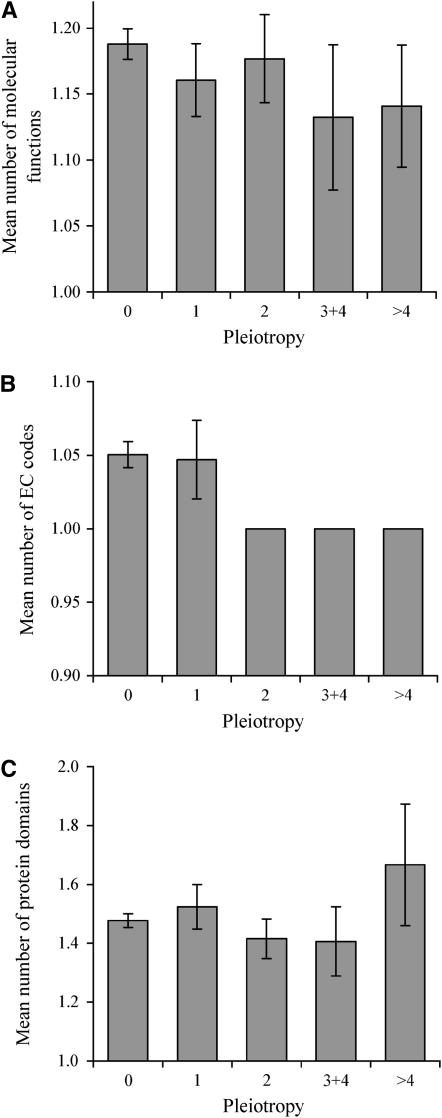
Figure 1.—
Gene pleiotropy is not due to an excess of molecular functions per gene. Mean numbers of (A) GO-annotated molecular functions per gene, (B) EC codes per gene, and (C) protein domains per gene for genes of different levels of pleiotropy. Pleiotropy is measured by the number of adverse conditions (of 21 tested conditions) under which the homozygous gene-deletion strain shows significantly slower growth than under the control condition. For the unbinned data, the rank correlation coefficient is −0.01 (P = 0.57), −0.06 (P = 0.09), and 0.01 (P = 0.62) between pleiotropy and the numbers of molecular functions, EC codes, and protein domains, respectively. The numbers of genes in the five bins are 1890, 193, 164, 68, and 71, respectively, in A; 755, 64, 60, 18, and 20, respectively, in B; and 1213, 105, 89, 32, and 33, respectively, in C. Error bar shows one standard error of mean.

