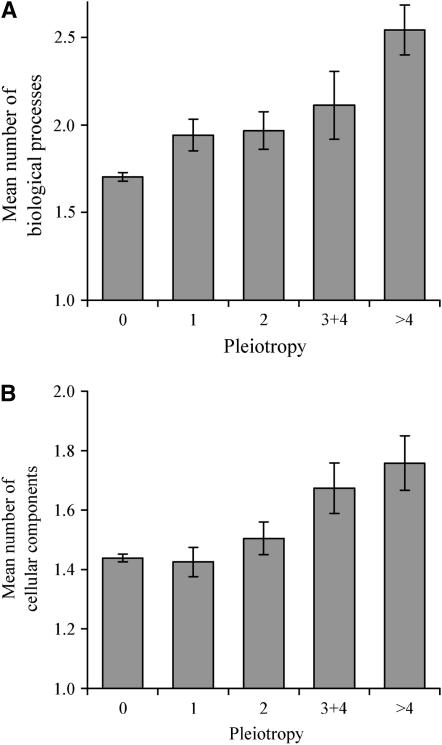
Figure 2.—
Gene pleiotropy correlates with (A) the number of GO-annotated biological processes and (B) the number of GO-annotated cellular components into which gene products are distributed. Pleiotropy is measured by the number of conditions under which the homozygous gene-deletion strain shows significantly slower growth than under the control condition. For the unbinned data, the rank correlation coefficient is 0.12 (P < 10−10) and 0.05 (P < 0.003) between pleiotropy and the numbers of biological processes and cellular components, respectively. The numbers of genes in the five bins are 2209, 244, 189, 88, and 92, respectively, in A and 2799, 268, 196, 92, and 95, respectively, in B. Error bar shows one standard error of mean.

