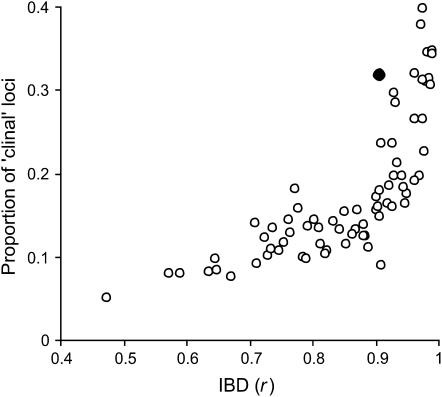
Figure 1.—
Relationship between the strength of IBD pattern quantified as Pearson correlation coefficient (r) and the proportion of loci showing significant clinal variation. Open circles correspond to 72 simulated data sets generated under the neutral evolutionary scenario consisting of 500 loci each; the filled circle represents an empirical D. melanogaster microsatellite data set (19 loci, 11 populations) from Gockel et al. (2001).

