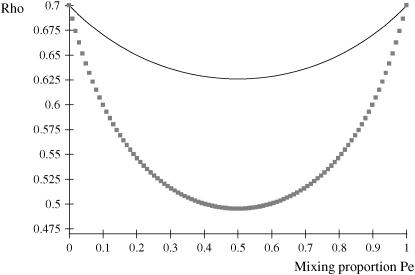
Figure 2.—
Phenotypic correlation (Rho) between a Gaussian character and a mixture trait for a two-component mixture, as a function of the mixing proportion (Pe). (1) ρhomo = 0.7, Δ = 1 (solid line); (2) ρhomo = 0.7, Δ = 2 (line with squares). ρhomo, phenotypic correlation in the absence of a mixture; Δ, difference between means of the two distributions.

