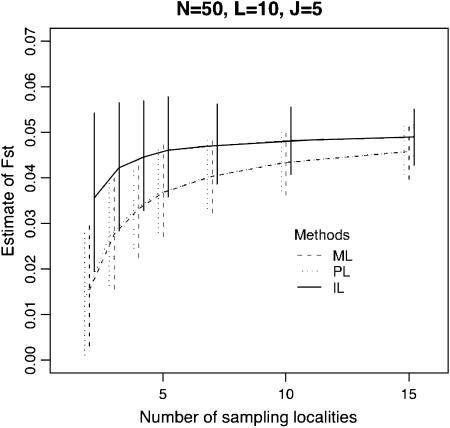
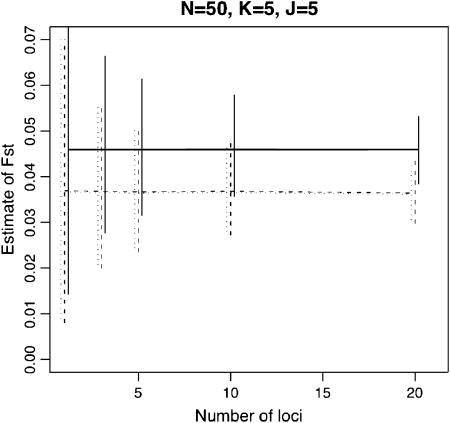
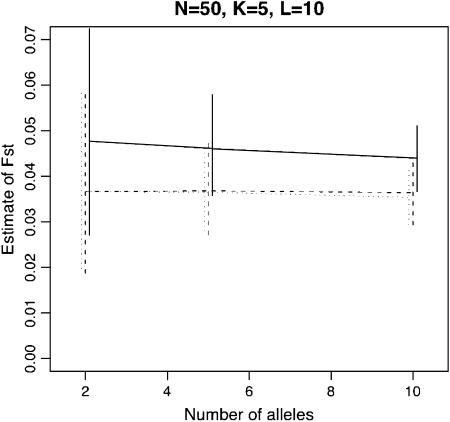
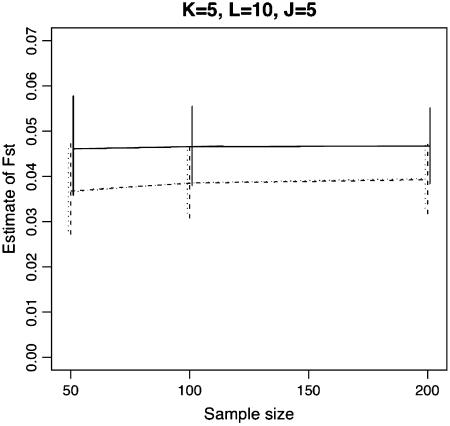
Figure 2.—
Means of ML, PL, and IL estimates with the 5th and 95th percentiles (vertical lines). The true FST was fixed at 0.05. The baseline scenario was K = 5, L = 10, J = 5, and N = 50 with  . x-Axes are different for each part: the number of sampling localities (K), the number of loci (L), the number of alleles (J), and the sample size common to sampling localities (N).


