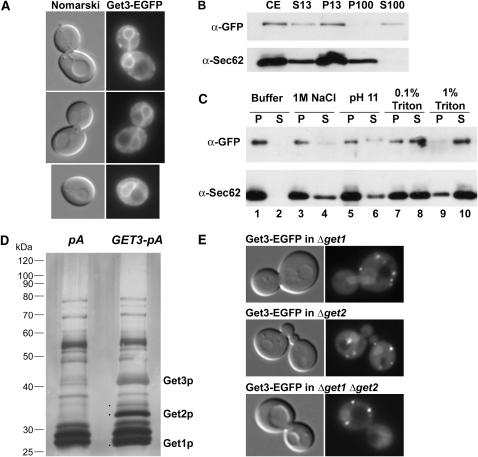
Figure 4.—
ER-membrane localization of Get3 requires Get2 and Get1. (A) Get3-EGFP localizes to the nuclear/ER membrane in rich media, by live cell fluorescence microscopy. Corresponding Nomarski image of cells is shown to the left. (B) Get3-EGFP cofractionates with both soluble and membrane-bound fractions. Cellular extract (CE) was separated into pellet and supernatant fractions following centrifugation at 13,000 rpm (P13 and S13, respectively). The S13 fraction was then subjected to ultracentrifugation at 100,000 rpm and separated into pellet and supernatant fractions (P100 and S100). Corresponding volumes from each isolated fraction were separated by SDS–PAGE and Western blotted with anti-GFP or anti-Sec62 antibodies as indicated. (C) The P13-associated fraction of Get3-EGFP is tightly membrane associated. The P13 fraction as in B was washed with either buffer alone (lanes 1 and 2) or buffer with 1 m NaCl (lanes 3 and 4), 0.2 m Na2CO3 pH 11 (lanes 5 and 6), 0.1% Triton X-100 (lanes 7 and 8), or 1% Triton X-100 (lanes 9 and 10). The samples were then recentrifuged and separated into pellet (P, odd lanes) or supernatant fractions (S, even lanes), which were analyzed by Western blotting as above. (D) Get3 biochemically copurifies with Get2 and Get1. Solubilized membranes from cells expressing Get3-TEV-proteinA (GET3-pA) or protein A alone (pA) were incubated with IgG Sepharose beads. After extensive washing, bound proteins were treated with TEV protease. Proteins released by this treatment were separated by SDS–PAGE and visualized by silver staining. Specific bands marked with a dot were excised for analysis by MALDI-TOF mass spectrometry and two of these bands were identified as Get2 and Get1 as labeled. The protein band corresponding to Get3 is also indicated. (E) Get3-EGFP mislocalizes in the absence of GET2 and/or GET1. Get3-EGFP was visualized by live-cell fluorescence microscopy in Δget1, Δget2, or Δget1 Δget2 cells grown in rich media to logarithmic phase. Images are representative of analysis of more than one clone for each genotype.

