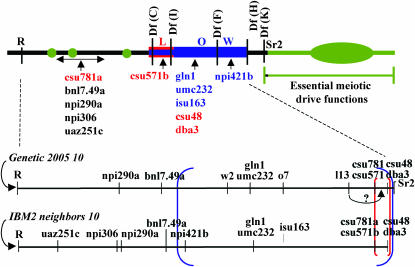
Figure 4.—
The Ab10-I molecular map. The RFLPs are positioned with respect to the deficiencies used in the mapping effort. The comparison of Ab10-I to N10 reveals two nested inversions, the larger in blue and the smaller in red and blue (to indicate that region has been inverted twice). Only a very small segment of the region distal to Df(K) (containing the Sr2 locus) can be confirmed as having been derived from N10; the remaining DNA is supernumerary. Supernumerary DNA is indicated in green. Below the Ab10-I map are the N10 RFLP maps from Figure 2. The boundaries of the inversions are indicated with brackets of the appropriate color. As noted, the position of L13 appears to be incorrect on the Genetic 2005 map, since both L13 and csu571b lie in the Df(C)–Df(I) interval.

