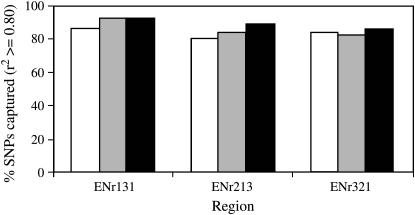
Figure 2.—
Evaluation of tagging performance. Tagging SNPs were selected from HapMap Chinese (CHB), Japanese (JPT), and the combined samples using Tagger at full density and applied to the 90 Korean individuals. An aggressive tagging mode with the same settings in Tagger was used for both selection of tagging SNPs and a test of their performance. Open bars denote CHB, shaded bars JPT, and solid bars the combined set of Chinese and Japanese samples (CHB + JPT).

