
FIGURE 5.
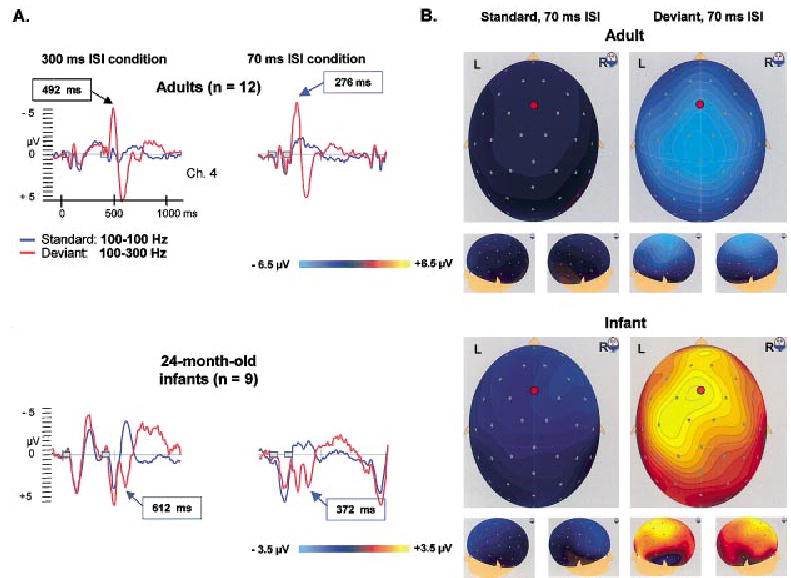
Panel A: Brain electrical responses (averaged across participants) for tone pairs with the within-pair intervals of 70 and 300 ms in adults (n = 12) and 24-month-old infants (n = 9). The stimuli presentations are represented by two gray boxes. Panel B: Scalp surface maps of the standard and deviant responses at the time point of the peaks indicated by the blue arrows in Panel A. The red circles on the surface maps indicate the electrode site from which the ERPs displayed in Panel A are taken. Note the different scaling of the potential maps for the ERPs of adults and infants.