
Figure 2.
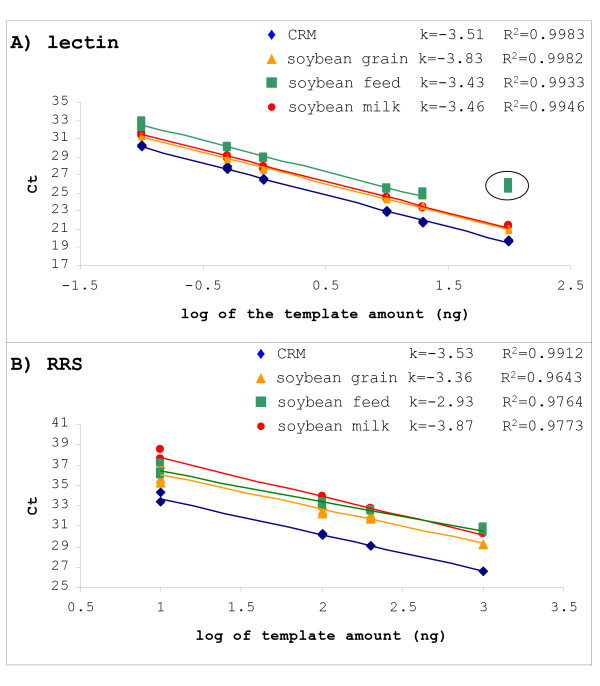
Efficiency of amplification in 4 soybean matrixes. Standard curves made by serial dilution of DNA isolated from 4 sample matrixes are shown for (A) the species specific gene (lectin) and (B) the transgene (RRS). The position of RRS curves for food materials is shifted from the CRM standard curve due to lower content of GM material in spiked food samples, as expected. The slope and correlation coefficient of the linear regression line are given. The highest concentration of soybean feed DNA was inhibited in the lectin and therefore excluded from the standard curve (encircled in plot A).