
Figure 5.
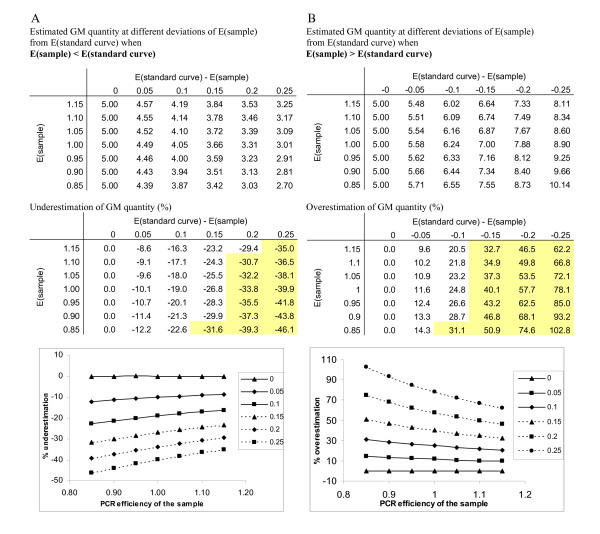
Influence of PCR efficiency on accuracy of GM content determination. The effect of PCR efficiency on the estimated GM content is shown for a theoretical case of 5% GMO when (A) PCR efficiency of the sample is higher then the PCR efficiency of the standard curve and when (B) the PCR efficiency of the sample is lower then the PCR efficiency of the standard curve. Effect of the difference of PCR efficiencies was modelled when E(sample) deviates form E(standard curve) for 0, 0.05, 0.10, 0.15, 0.20 and 0.25. Upper table (in both A and B) shows the determined GM percentage at different deviations of PCR efficiency. Lower table shows the deviation of the estimated GM content from true value in %. Results that deviate from true value for more then 30% are shaded in yellow. In the plots dependency of the of under- or overestimation of the GM content on the PCR efficiency of the sample is shown when E(sample) deviates form E(standard curve) for 0, 0.05, 0.10, 0.15, 0.20 and 0.25. (E = PCR efficiency).