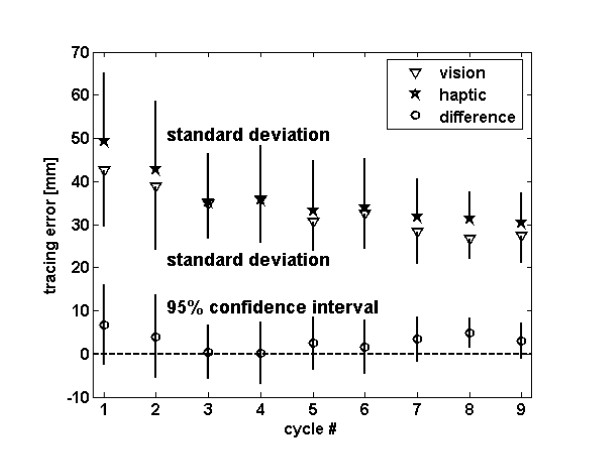
Figure 2.
Improvement in tracing error across training cycles. The triangles show the average tracing error after visual demonstration during the recall phase of each cycle. The stars show the average tracing error after haptic guidance during the recall phase of each cycle. The bars show one standard deviation across arms tested. The circles show the difference of tracing error between haptic and visual training, along with the 95% confidence interval for the difference.

