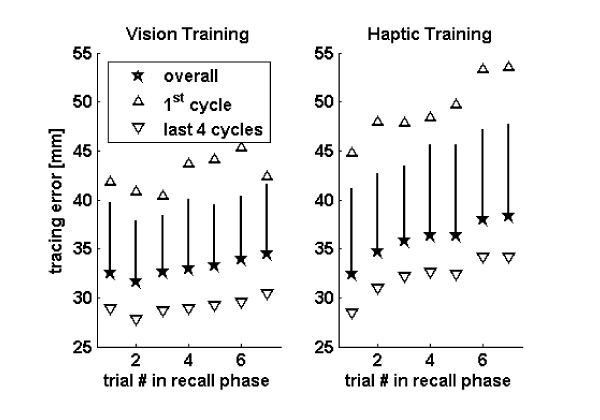
Figure 3.
Forgetting during the recall phase of each cycle. The stars show the tracing error after visual (left) or haptic (right) training during the recall phase. The up pointing triangles are the average tracing error in the first cycle across the 20 subjects. The down pointing triangles are the average tracing error in the last 4 cycles across the 20 subjects. The error bars are the standard deviations across the 20 subjects.

