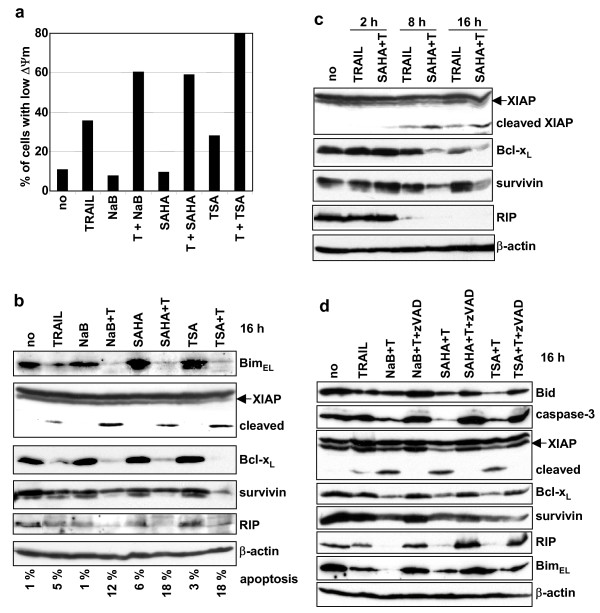
Figure 5.

Activation of the mitochondrial signalling pathway. A SH-EP cells were untreated (no) or treated with TRAIL (50 ng/ml) and M2 (250 ng/ml) (T) and/or NaB (1 mM), SAHA (2.5 μM) or TSA (0.5 μM) for 20 h. The loss of ΔΨm was measured using the fluorescent probe JC-1. The percentage of cells with low ΔΨm is indicated. B Simultaneous treatments with TRAIL and HDACIs induce inactivation of anti-apoptotic proteins. SH-EP cells were treated as described in Fig. 3b. Percentage of apoptotic cells (sub-G1 population) as analysed by the PI staining method after 16 h of treatments are indicated. C Time-course analysis of anti-apoptotic protein cleavage. SH-EP cells were treated as in Fig. 4a. D Co-treatments with TRAIL and HDACIs induce caspases-dependent cleavages of pro- and anti-apoptotic proteins. SH-EP cells were untreated or treated with TRAIL (25 ng/ml) and M2 (125 ng/ml), or with TRAIL (T)+NaB (1 mM), T+SAHA (2.5μM) or TSA (0.5 μM) in the presence or absence of zVAD for 16 h. b, c, and d. Whole cell extracts were analysed by immunoblotting for the presence of different pro- and anti-apoptotic proteins. β-actin was used as loading control.
