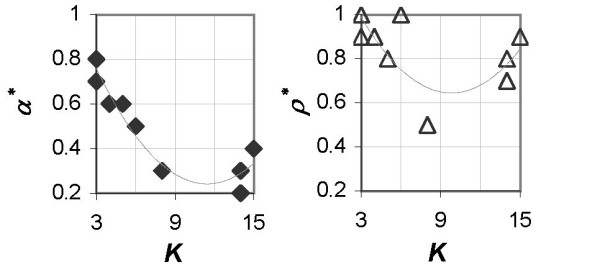
Figure 6.

Relationship between optimal value of the DDP and number of classes in the dataset. Optimal value of the DDP plotted against number of classes in the dataset for the WA,S scoring method (left) and the WR,S scoring method (right) for all benchmark datasets.
