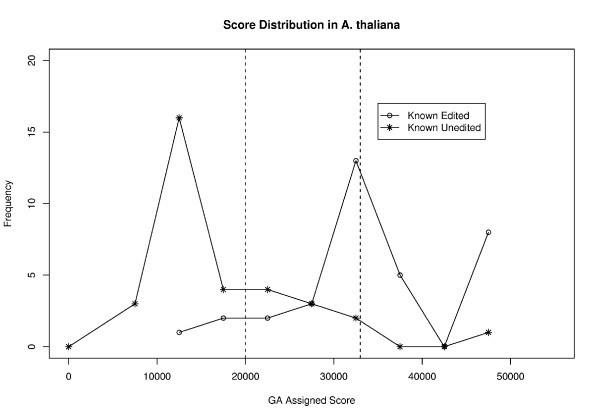
Figure 1.
Distribution of GA assigned scores for a test data set in A. thaliana. The distribution of GA assigned scores for one of the cross validation test data sets is shown here. This data set, which is fairly representative, had a total of 35 known edited sites and 37 known unedited sites, of which 23 known edited sites and 25 known unedited sites were in the 90% credible intervals. The dashed lines indicate the boundaries of the 90% credible intervals; a score of 20,000 or less indicates a ≥ 0.9 probability that the site is unedited and a score of 33,000 or greater indicates a ≥ 0.9 probability that a site is edited.

