Figure 3.


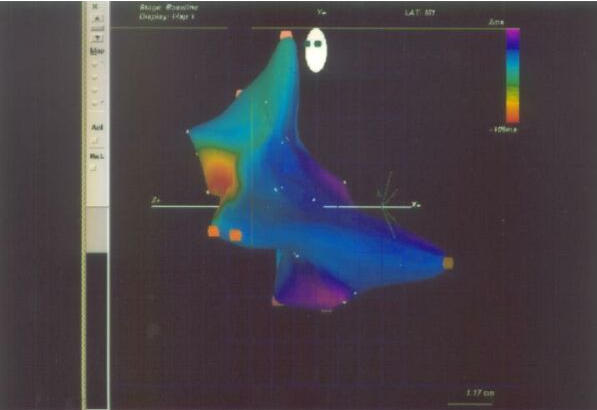
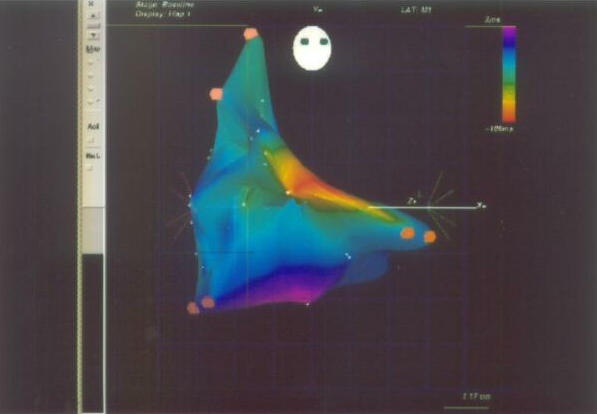
Electroanatomic mapping on CARTO system of focal right atrial tachycardia showing earliest activation (red color) below crista terminalis. LAO 40° projection ( Figure 3A) and RAO 30° projection (Figure 3B).


Electroanatomic mapping on CARTO system of focal right atrial tachycardia showing earliest activation (red color) below crista terminalis. LAO 40° projection ( Figure 3A) and RAO 30° projection (Figure 3B).