Figure 5.

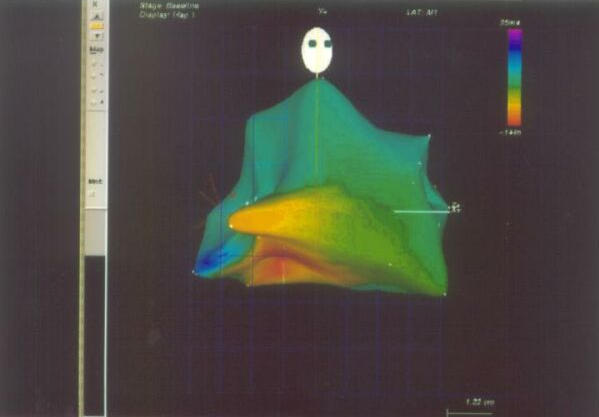
Isochronal mapping on CARTO system of left ventricle showing earliest activation (red color) in the inferobasal region suggestive of left ventricular tachycardia (RAO projection).

Isochronal mapping on CARTO system of left ventricle showing earliest activation (red color) in the inferobasal region suggestive of left ventricular tachycardia (RAO projection).