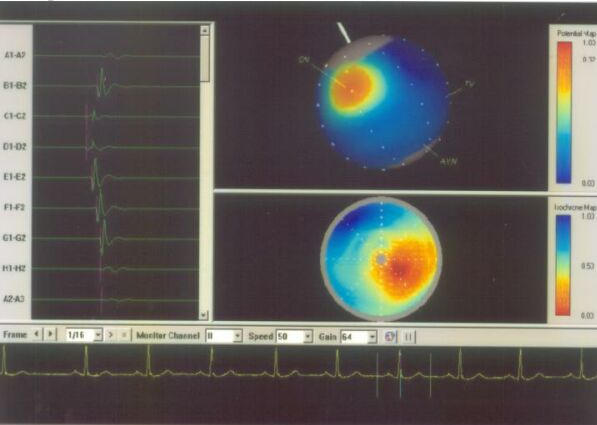
Figure 6A.

Basket mapping of normal sinus rhythm. The right upper panel shows the potential map, the earliest activation (red color) at the site of sinus node. In addition, the splines of basket catheters are aligned with the endocardial wall. The right lower panel shows isochronal map of the sinus rhythm. The left panel shows the electrogram from the different splines. SN= Sinus node; TV= tricuspid valve; AVN= Atrioventricular node.
