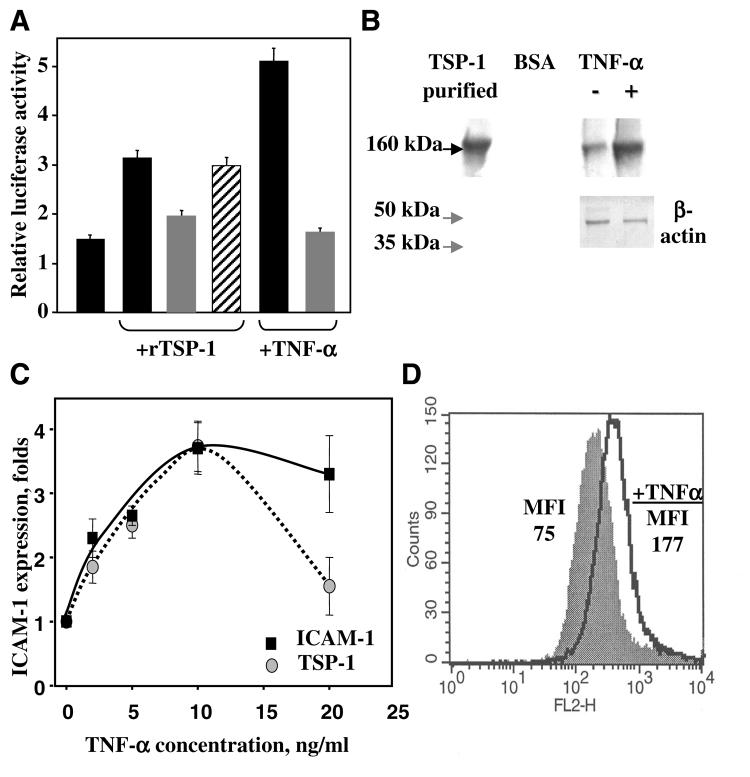
Figure 6.
A) The effect of rTSP-1 and TNF-α on NF-κB activity in HUVEC (solid bars), HUVEC infected with adenovirus-encoding inhibitor of NF-κB (I-κB; shaded bars), and HUVEC infected with adenovirus-encoding GFP (striped bar). rTSP-1 concentration was 5 μ g/ml; TNF-α concentration was 10 ng/ml. NF-κB activity was analyzed using a luciferase reporter assay. Effect of TNF-α on the expression of IAP and TSP-1 on the EC. B) Western blot shows the level of TSP-1 synthesis in HUVEC after 17 h of treatment with TNF-α. The cell lysate was subjected to Western blot using TSPB-7 mAb against TSP-1. β-actin was used as a loading control. C) Effect of various concentrations of TNF-α on ICAM-1 (solid box) and TSP-1 (shaded circle) expression on HUVEC. The increases in MFI over control (PBS buffer) are shown. The data are means ± sd of three experiments. D) Representative data of FACS analysis. B6H12 mAb were used to assess the surface expression of IAP: shaded spectra, nontreated cells; open spectra, cells treated with 10 ng/ml TNF-α for 17 h.

