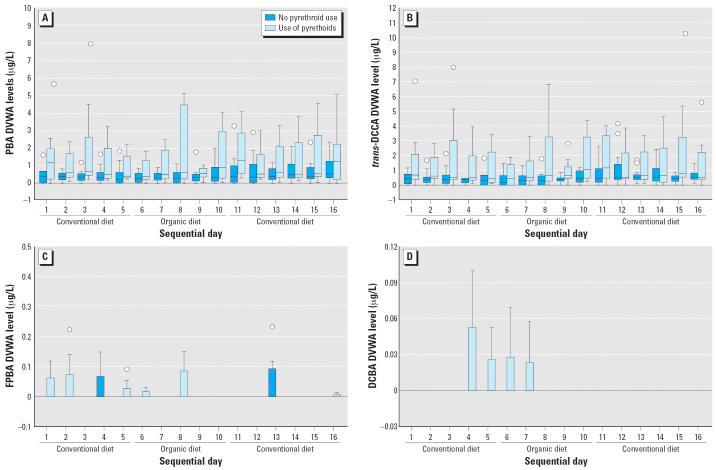
Figure 1.
Box plots, separated by self-reported residential use of pyrethroid pesticides, of DVWA of pyrethroid concentrations in 23 children 3–11 years of age for 15 consecutive days in which conventional and organic diets were consumed: (A) PBA, (B) trans-DCCA, (C) FPBA, and (D) DBCA. In the box plots, the horizontal lines in each plot represent 10th, 25th, 50th, 75th, and 90th percentiles, bottom to top. Circles represent outlier values. Extreme values are not included in the plots.

