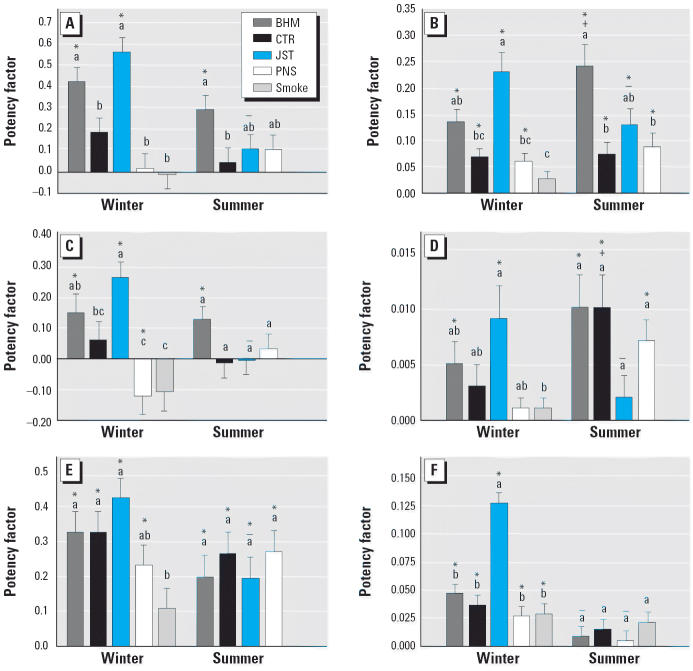
Figure 4.
Inflammatory potency varies with site and season. (A) Total cells. (B) Polymorphonuclear leukocytes. (C) Macrophages. (D) Lymphocytes. (E) Histopathologic inflammation. (F) Lung weight:body weight ratio. Bars represent potencies for the inflammatory end points (mean and SE).
Letters above the bars indicate samples within a season that are not significantly different from each other; “+” and “–” indicate potency significantly greater than and less than, respectively, the potency of the sample from the same site in the winter. *Potency significantly different from 0.

