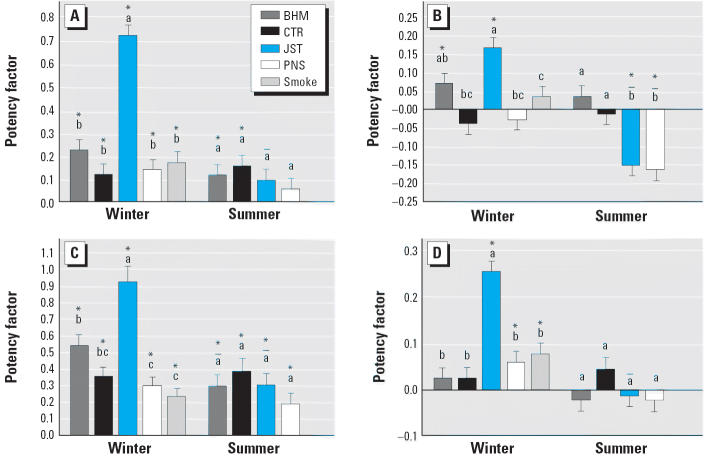
Figure 5.
Cytotoxicity potency varies with site and season. Bars represent potencies for the inflammatory end points (mean and SE). (A) LDH. (B) APase. (C) Protein. (D) Histopathologic cytotoxicity.
Letters above the bars indicate samples within a season that are not significantly different from each other; “–” indicates potency significantly less than the potency of the sample from the same site in the winter. *Potency significantly different from 0.

