Figure 2.

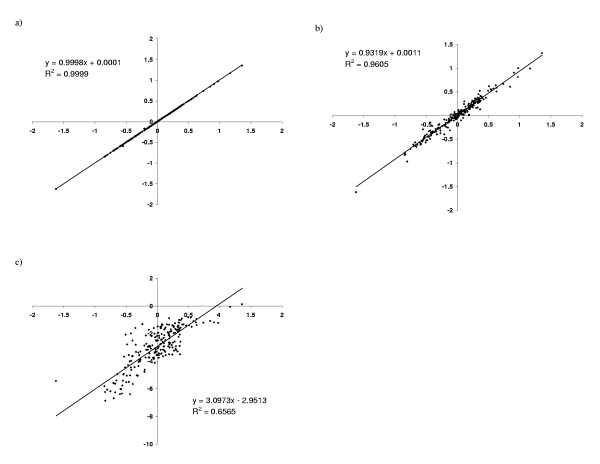
XY-comparisons of pairwise contact potentials. (a) two independent runs on the same data set DS1, (b) two runs, on data sets DS1 (X-axis) and DS2 (Y-axis); (c) Miyazawa and Jernigan's potential, compared to that obtained on DS1.

XY-comparisons of pairwise contact potentials. (a) two independent runs on the same data set DS1, (b) two runs, on data sets DS1 (X-axis) and DS2 (Y-axis); (c) Miyazawa and Jernigan's potential, compared to that obtained on DS1.