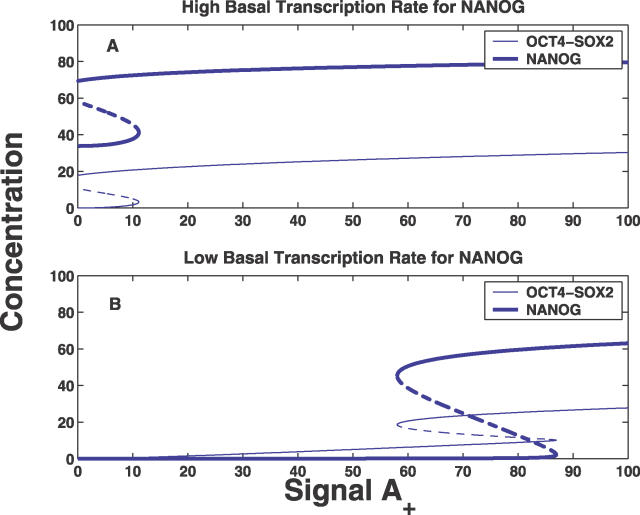
Figure 12. The Effects of Overexpression of NANOG on the OCT4–SOX2 and NANOG Concentration.
(A) Shows the OCT4–SOX2 and NANOG concentration showing irreversible bistability, when NANOG is overexpressed through a high value for the basal rate of transcription (i.e., η 5). Hence its expression remains on even on removal of the signal A +.
(B) Shows OCT4–SOX2 and NANOG concentrations (the same as in Figure 3) exhibiting bistable behavior, which have negligible basal rates of transcription for NANOG, but which require the signal for the stem cell box to be on.

