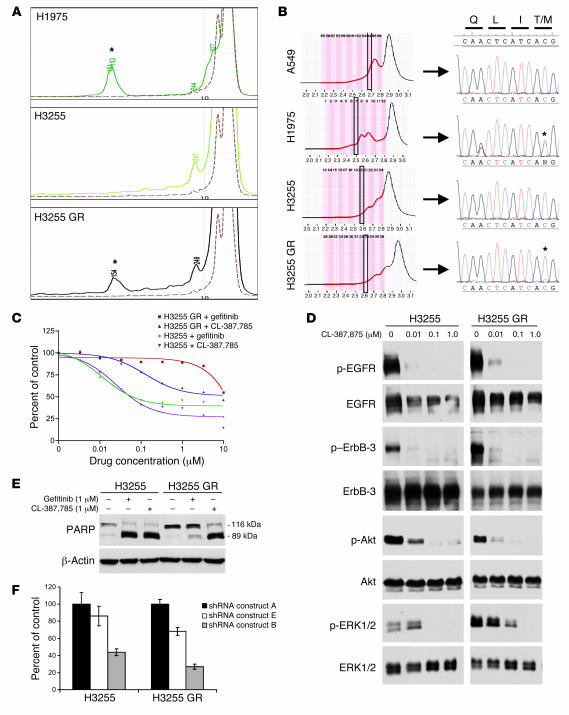
Figure 2. H3255 GR harbors a T790M mutation and is growth-inhibited by an irreversible EGFR inhibitor (CL-387,785) and EGFR-specific shRNA.
(A) Exon 20 was amplified by PCR analysis, subjected to SURVEYOR analysis, and analyzed using the WAVE system (see Methods). Shown are HPLC tracings; numbers represent fragment size. Note the presence of a 154-bp fragment in H3255 GR, suggesting a T790M mutation (asterisks), as observed in the H1975 cells (positive control). A549 (dashed line) is shown as a negative control. (B) Exon 20 was amplified from A549 (negative control), H1975 (positive control), H3255, and H3255 GR cells. Products were separated at a partially denaturing temperature using the WAVE system. The indicated fractions (boxed areas) were directly sequenced (see Methods). The T790M mutation was observed in H3255 GR and H1975 cells (asterisks). (C) H3255 and H3255 GR cells were treated with increasing concentrations of CL-387,785 or gefitinib and subjected to an MTS survival assay. (D) Western blot analysis of H3255 and H3255 GR cells treated with increasing concentrations of CL-387,785. Blots of H3255 and H3255 GR extracts for each antibody are the same exposure from a single gel and blot; irrelevant lanes between the H3255 and H3255 GR extracts were omitted. (E) Western blot for PARP with H3255 and H3255 GR cells following treatment with gefitinib or CL-387,785 for 72 hours. (F) Lentiviral constructs containing EGFR shRNAs were infected into H3255 and H3255 GR cells, followed by an MTS assay. Growth was normalized to shRNA construct A (control), which did not cause significant EGFR downregulation (Supplemental Figure 4).

