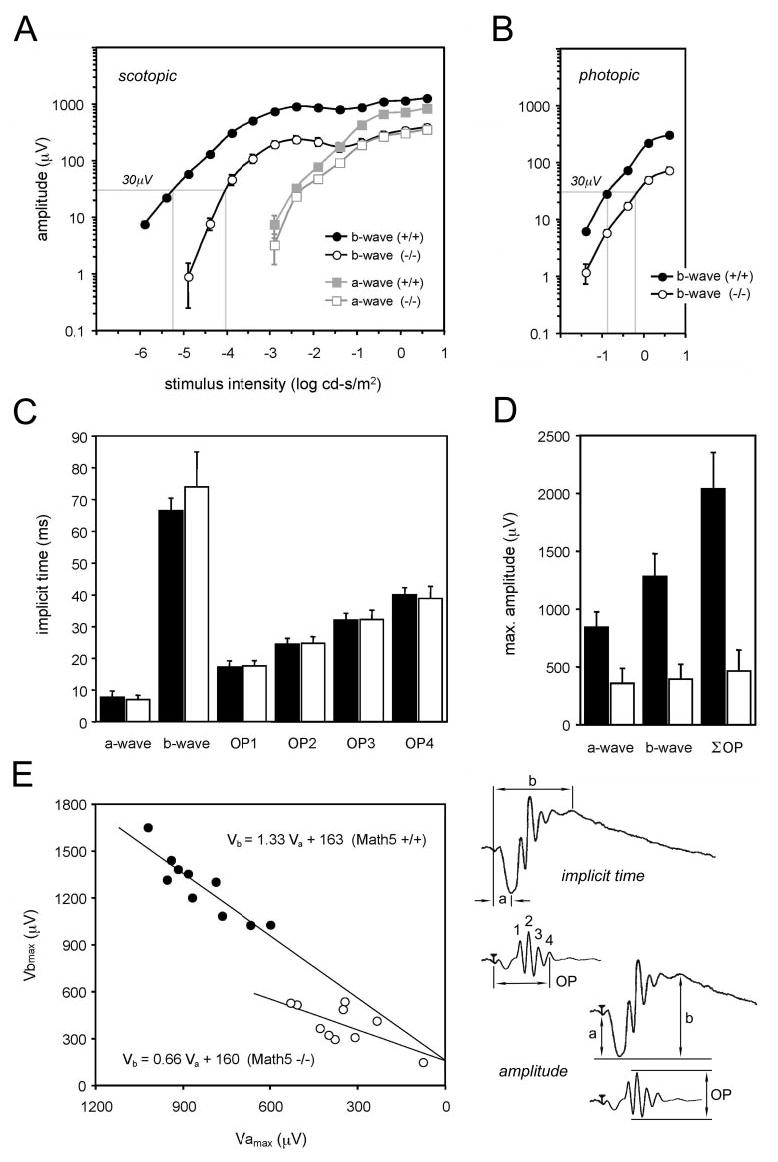
Figure 4.

Quantitative ERG analysis of wild-type and Math5-null mice. (A) Intensity vs. response (V − log I) plots for the scotopic b- and a-wave. (B) Intensity vs. response plots for the photopic b-wave. The intensity necessary to produce a 30-μV b-wave response is indicated in each panel by the gray line crossing the horizontal axis. The amplitudes are significantly reduced in Math5−/− retinas at all light intensities (t-test, *P < 0.05), except for scotopic a-waves recorded at −2.4 and −2.9 log cd-s/m2. Each point shows the average data recorded from 10 eyes (5 mice) ± SEM. (C) The implicit times for the scotopic a-, b- and OP waves recorded from wild-type (▪) and Math5−/− (□) mice at maximum stimulus intensity. (D) Comparison of a-wave, b-wave, and oscillatory potential amplitudes in wild-type (▪) and Math5−/− (□) mice. ∑OP is the sum of the four largest oscillatory waves. The bottom right diagram shows how amplitudes and implicit times were measured. Error bars: SD. (E) Plot showing the altered relationship between scotopic maximum a-wave (Vamax) and b-wave (Vbmax) amplitudes in Math5−/− mice. Each symbol represents a different eye. The least-squares regression lines and equations are indicated. The b-wave was disproportionately reduced in the mutants. (○) Math5−/− (•) wild-type mice.
