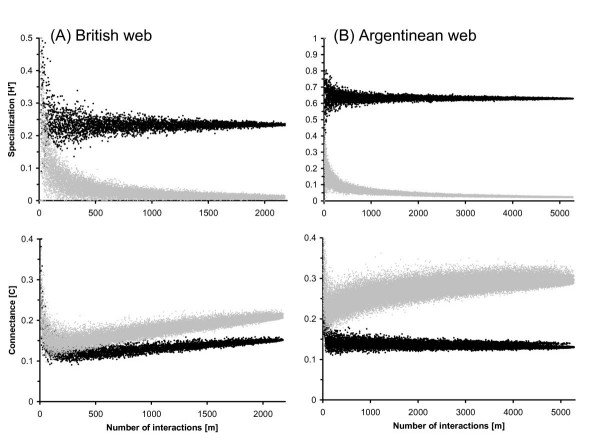
Figure 2.

Sampling effect in pollinator networks. Rarefaction of sampling effort in a British and an Argentinean pollination web [32,33]. Two network-level measures of specialization – the frequency-based specialization index (H2') and the 'connectance' index (C) – are shown for networks in which the total number of interactions (m) has been reduced by randomly deleting interactions. Black dots show the effect of sampling effort for the original association matrix, gray dots the effect for a null model, i.e. five networks in which partners were randomly associated (same row and column totals as in the original matrix).
