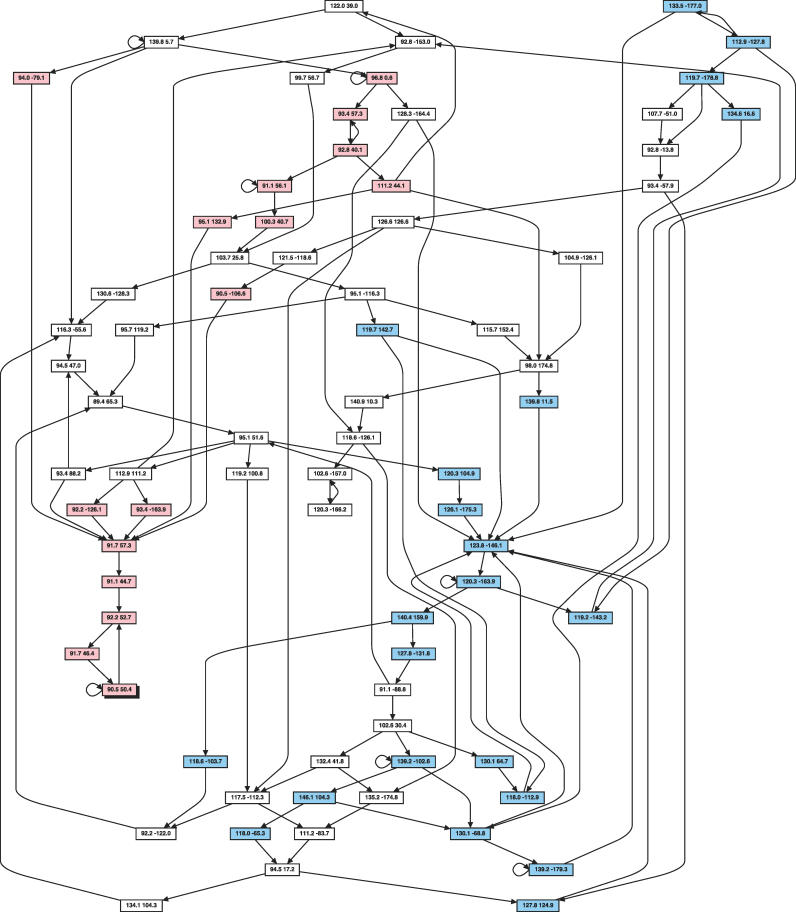
Figure 3. Transitions Occurring between (θ,τ) Angle Pairs in Proteins according to FB5–HMM.
The graph shows some of the most important possible hidden node transitions in FB5–HMM. Each hidden node value is represented as a box, showing the associated mean direction as a pair of (θ,τ) angles. For clarity, only a subset of all transitions is shown: for each hidden node value, the incoming and the outgoing transition with the highest probability is shown as an arrow. If one of them is a self-transition, the second best incoming or outgoing transition is also shown. Hidden node values mainly associated with α-helices are shown in light red, with β-strands in light blue, and with coils in white.

