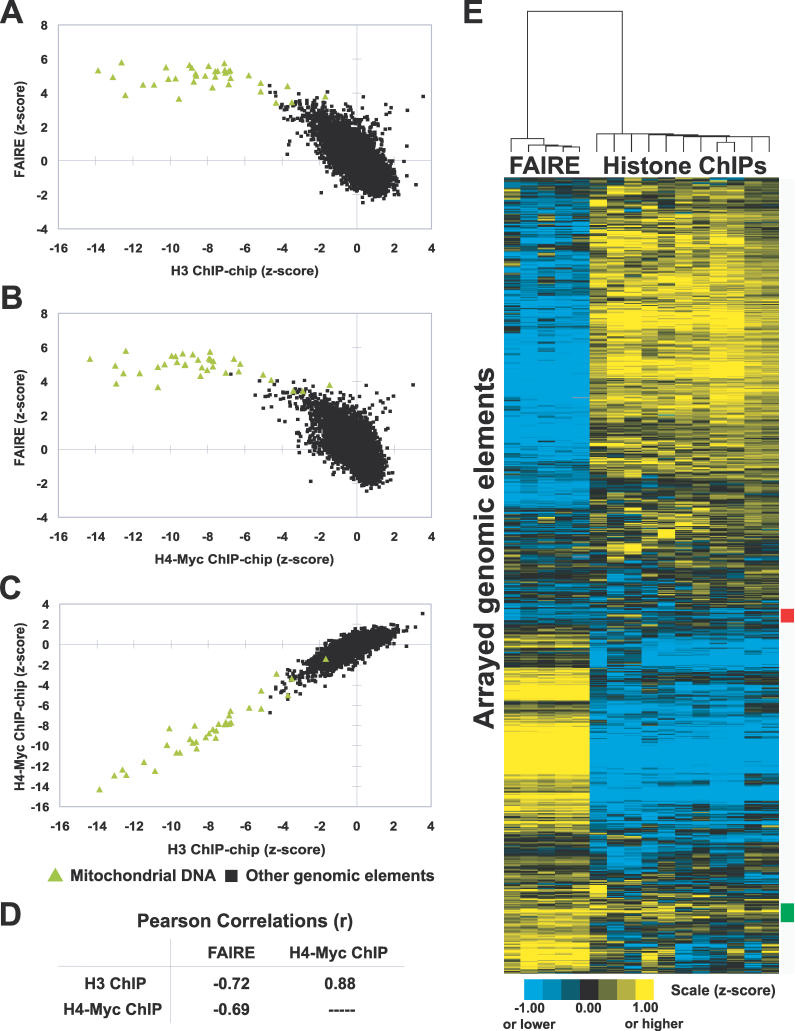
Figure 1. Inverse Correlation of FAIRE and Histone H3 and H4-myc ChIP-chip Data.
(A–C) Enrichment values from the indicated experiments were plotted. Green triangles indicate mitochondrial DNA probes, whereas black squares represent all other arrayed genomic segments. For FAIRE, data are derived from five biological replicates. The histone ChIP-chip data were previously published [20]. Individual arrays from FAIRE experiments and the histone ChIP-chips were transformed into z-scores, which controls for differences in variance between arrays by adjusting the standard deviation of each array to a value of 1.
(D) Table of Pearson correlations between FAIRE and histone H3 and H4-myc ChIP-chip data. The significance of the correlations between FAIRE and histone ChIP-chip experiments was tested by randomly permuting the FAIRE data 1,000,000 times. A greater anti-correlation than was observed with unpermuted data was not achieved (empirical p < 1 × 10⁻⁶).
(E) Hierarchical clustering by gene and by array was performed using the program Cluster [57]. All arrayed genomic elements were included. The 192 loci marked by the red box exhibit relative depletion in both FAIRE and histone ChIP-chip, but revealed no striking biases in terms of size, GC content, genomic location, or locus type (e.g., ORF, promoter, or telomeric). The 266 loci marked by the green box exhibit relative enrichment in both assays. They are mostly intergenic (76%), and of the ORFs present, 27.6% were dubious (versus 11.4% genome-wide). No other distinguishing features among the red or green groups could be identified.
For all figures in this paper, although the scales are discontinuous, the data shown are continuous.

