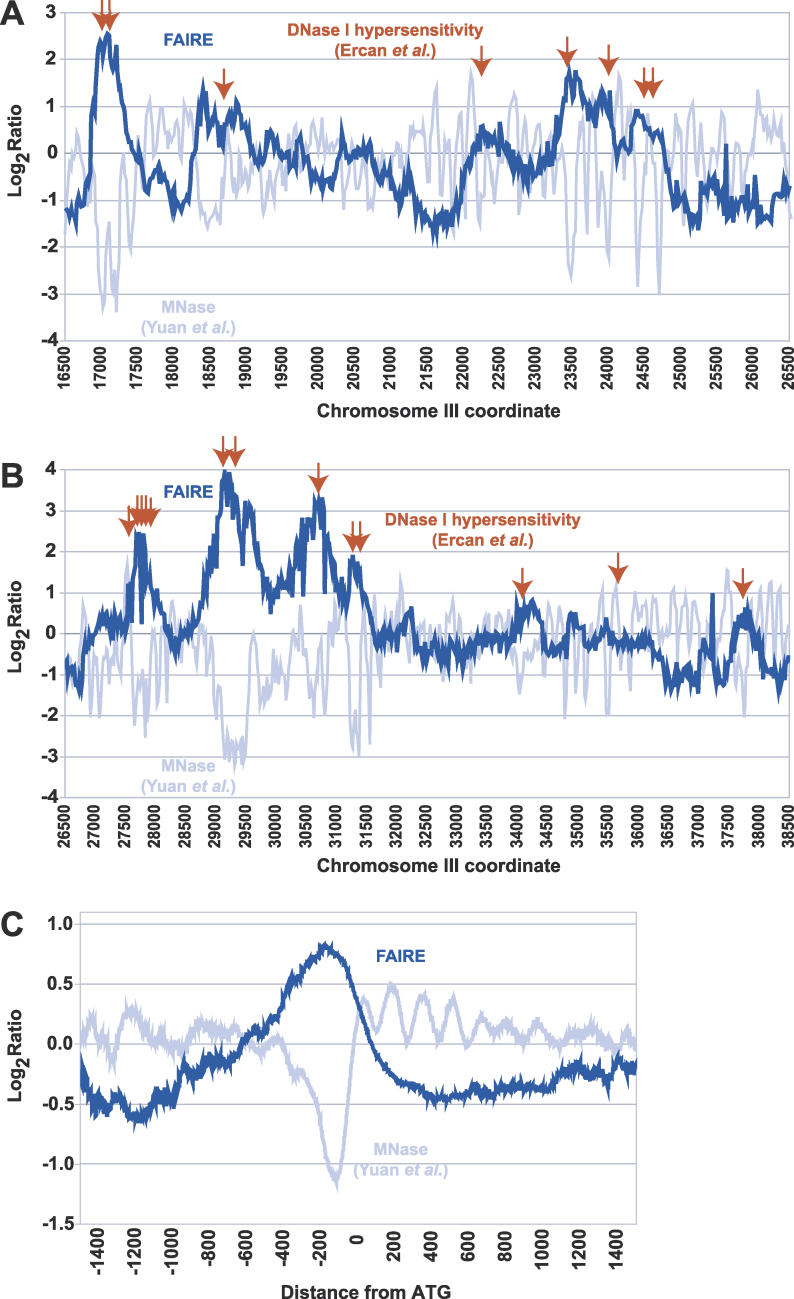
Figure 2. Peaks of FAIRE Enrichment Are Coincident with DNase I Hypersensitive Sites and NFRs.
(A) Raw data obtained through FAIRE (dark blue) and MNase treatment (light blue) [23] obtained from high-resolution tiling arrays are shown for a 10-kb region of Chromosome III (16500–26500). Red arrows represent previously mapped DNase I hypersensitivity sites [25].
(B) Same as (A), but for a 12-kb region on Chromosome III (26500–38500).
(C) Data from tiling arrays were aligned by distance from start codon and averaged over 50-bp windows (step size = 1).

