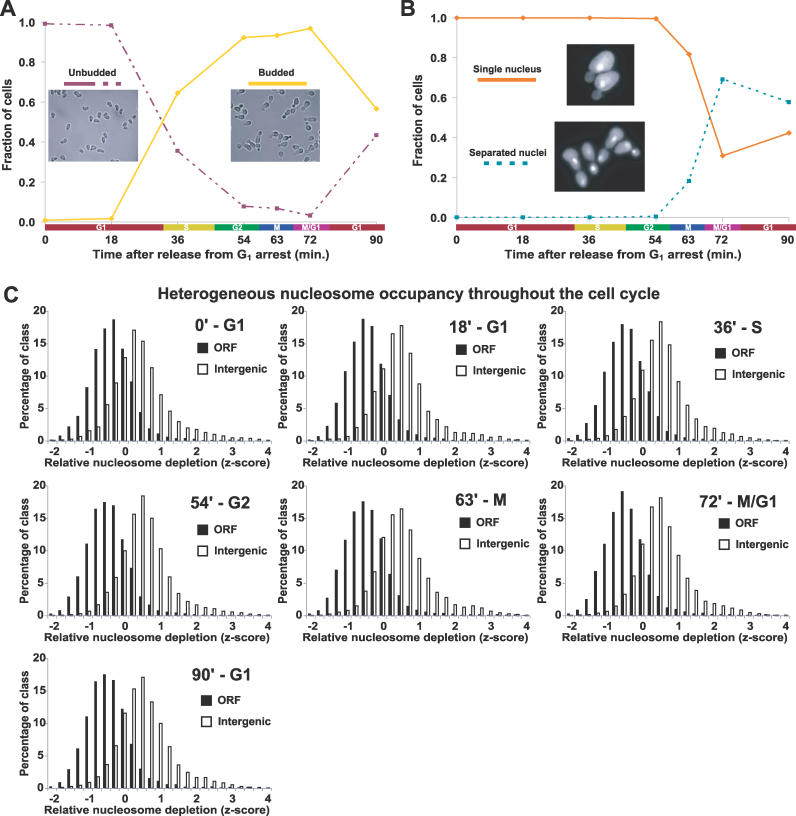
Figure 4. The Global Pattern of Nucleosome Occupancy Is Maintained throughout the Cell Cycle.
(A) To validate synchrony of cell cycle arrest and release, cells were scored as unbudded (G1) or budded (other phase) using brightfield images of every time point from each time course as described (Material and Methods). Each image represents one of the plotted groups, as indicated. Although the data shown were derived from a single time course, all time courses exhibit similar synchrony and growth. For a representative time course, Northern blots were performed using probes to CLN2 and the HHT transcripts, which also confirmed cell cycle synchrony and progression (unpublished data).
(B) Same as (A), except cells from each time point were stained with DAPI. Each yeast cell was scored as having a single nucleus (pre-mitotic) or separated nuclei (post-mitotic). Greater than 90% arrest in late G1 at the time of release was achieved for all cultures. Note that although the cells from the first time point (time 0) were arrested in G1, they were in a physiological state distinct from natural G1 as the result of induction of α-factor–responsive genes.
(C) The distribution of z-scores for SGD-annotated ORFs and intergenic non-coding segments plotted for each cell cycle time point. Each histogram is represented by all biological replicates collected at that time point. The approximate cell cycle phase is given next to the time after release from G1 arrest. For our analysis, normalized median log2 ratios from each array were transformed into z-scores to control for differences in variance between arrays, followed by calculation of mean z-scores for all biological replicates (Material and Methods).

